ETF tracking error explained: how to compare a tracker
Understand ETF tracking error and tracking difference, check a worked example, and compare fund returns fairly using dates, income, currency and costs.

Your tracker returned less than its index. Has something gone wrong? Before blaming the fund, separate the size of the shortfall from how consistently it occurred, then check that you are comparing the same thing.
The short version
Tracking difference is the return gap over a stated period. Tracking error measures how much the periodic return gaps vary. A fund can trail its index consistently and still have very low tracking error.
This guide concerns index-tracking exchange-traded funds, or ETFs: funds bought and sold on a stock exchange. Not every ETF is a tracker. For a tracker, read both measures alongside the benchmark, charges and calculation notes. Neither is a safety rating or a forecast.
Tracking difference versus tracking error
For this article, tracking difference = ETF total return minus index total return. A negative result means the ETF lagged; a positive result means it outperformed. Check the convention in any comparison tool, because reversing the subtraction reverses the sign.
Tracking error asks a different question: how variable were the gaps across a series of periods, such as months? Its standard statistical definition is the annualised standard deviation of those return differences. In plain English, it measures their spread around their average, expressed on a yearly basis. Vanguard’s technical explanation distinguishes the two measures.
Imagine a fictional ETF that trails its index by exactly 0.03 percentage points every month. The monthly gap never varies, so its tracking error is zero in this simplified series. It still underperforms. A second ETF whose monthly gap repeatedly switches between +0.09 and −0.15 percentage points has the same average monthly gap, but greater tracking error. That does not mean the two funds have identical compounded returns.
You cannot calculate tracking error from one annual return pair. When reading a published figure, check the observation period, daily or monthly frequency, and annualisation method. An expected figure is not a record of what actually happened.
A worked example: what a 0.4-point gap means
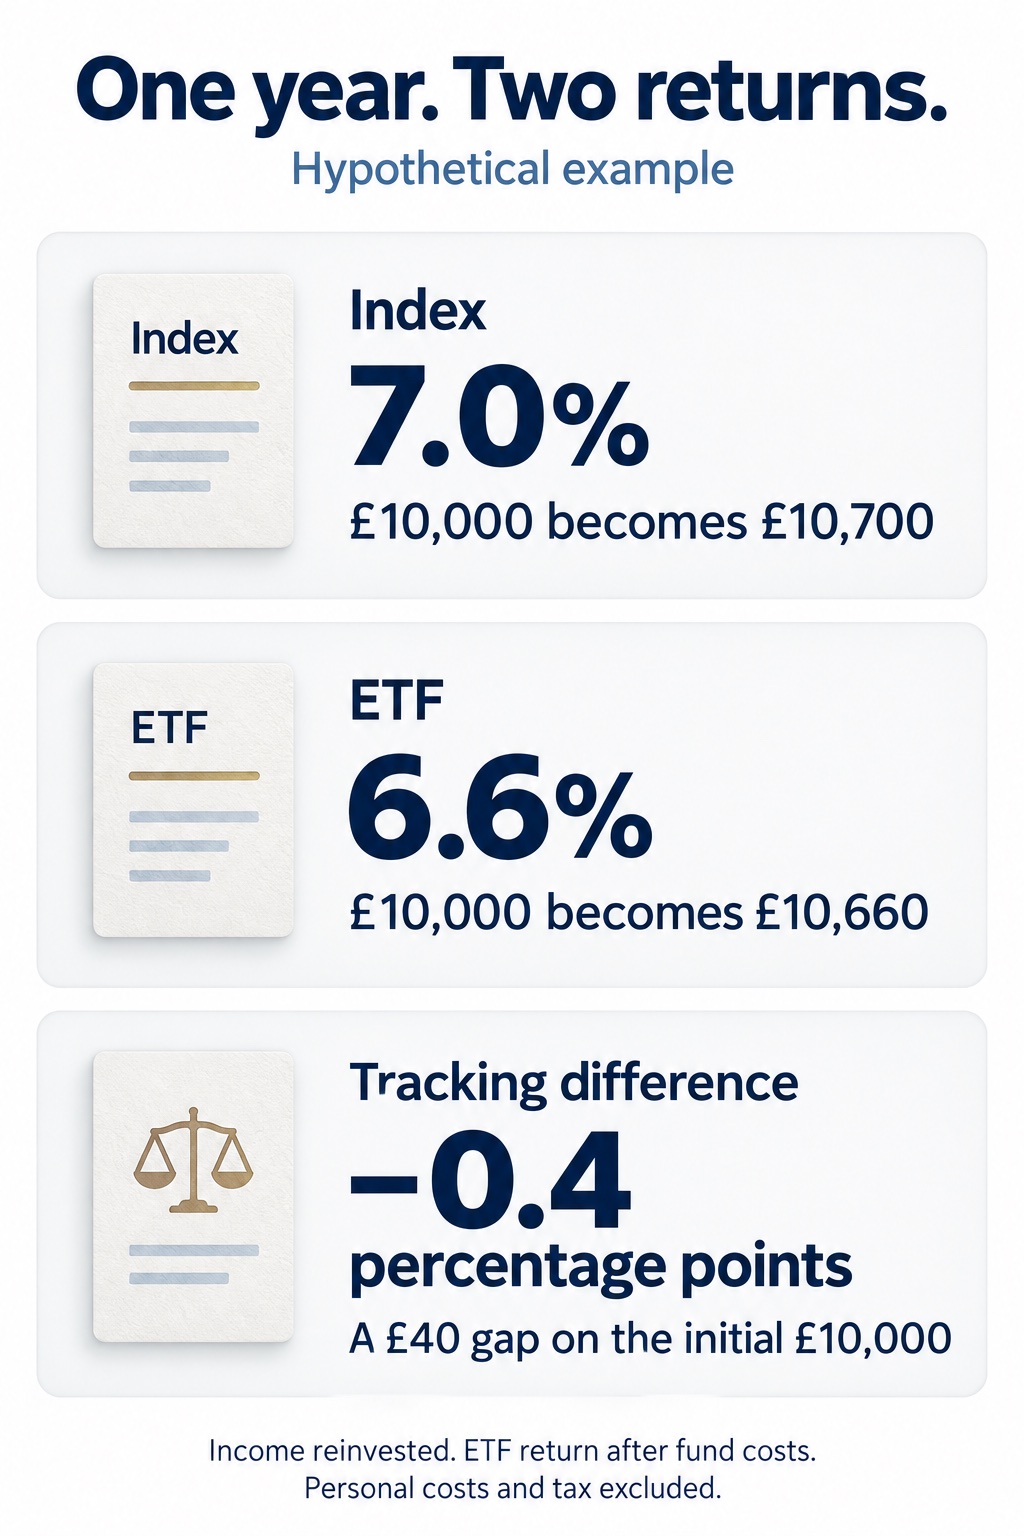
Suppose a fictional index and ETF report the following one-year total returns in pounds. Both include reinvested income and use identical dates. The ETF return is already net of fund-level costs; the index is a theoretical comparison, not an investment you can buy directly.
| Measure | Index | ETF |
|---|---|---|
| Total return | 7.0% | 6.6% |
| Starting value | £10,000 | £10,000 |
| Ending value | £10,700 | £10,660 |
The tracking difference is 6.6% − 7.0% = −0.4 percentage points, or minus 40 basis points. One basis point is 0.01 percentage points. The pound gap is £40 on the initial £10,000.
That is not a 0.4% charge on the ending balance, and it is not necessarily all fees. Do not deduct the ongoing charge again from a return that already includes it. Platform charges, your dealing costs and personal tax are excluded here, as are later contributions and withdrawals. Those can make your own result different.
Why a real fund differs from an index
An index applies a calculation rulebook. A fund must implement it. Ongoing charges reduce returns; trading costs arise when holdings change. Cash balances and transaction timing can also move the fund away from its benchmark. Withholding tax on investment income may differ from the index’s assumptions. These are possible explanations, not a diagnosis of a particular fund.
The copying method matters too. Full replication aims to hold the index’s securities in matching proportions. Sampling holds a selected subset, seeking similar characteristics where buying everything would be costly or impractical. Synthetic replication uses a swap, a financial contract with another institution, to obtain the index return. Vanguard explains these structures and their trade-offs.
A swap introduces counterparty risk: the institution may fail to meet its obligations. Collateral and other controls can reduce this risk, not make the arrangement risk-free. Close tracking alone does not tell you which structure suits you.
Some funds also earn income by lending securities. BlackRock’s lending explanation describes the fees received and the borrower and collateral risks. Income retained by the fund can offset part of its costs. That is one reason tracking difference need not equal the advertised ongoing charge or always be negative.
Compare the labels before comparing the numbers
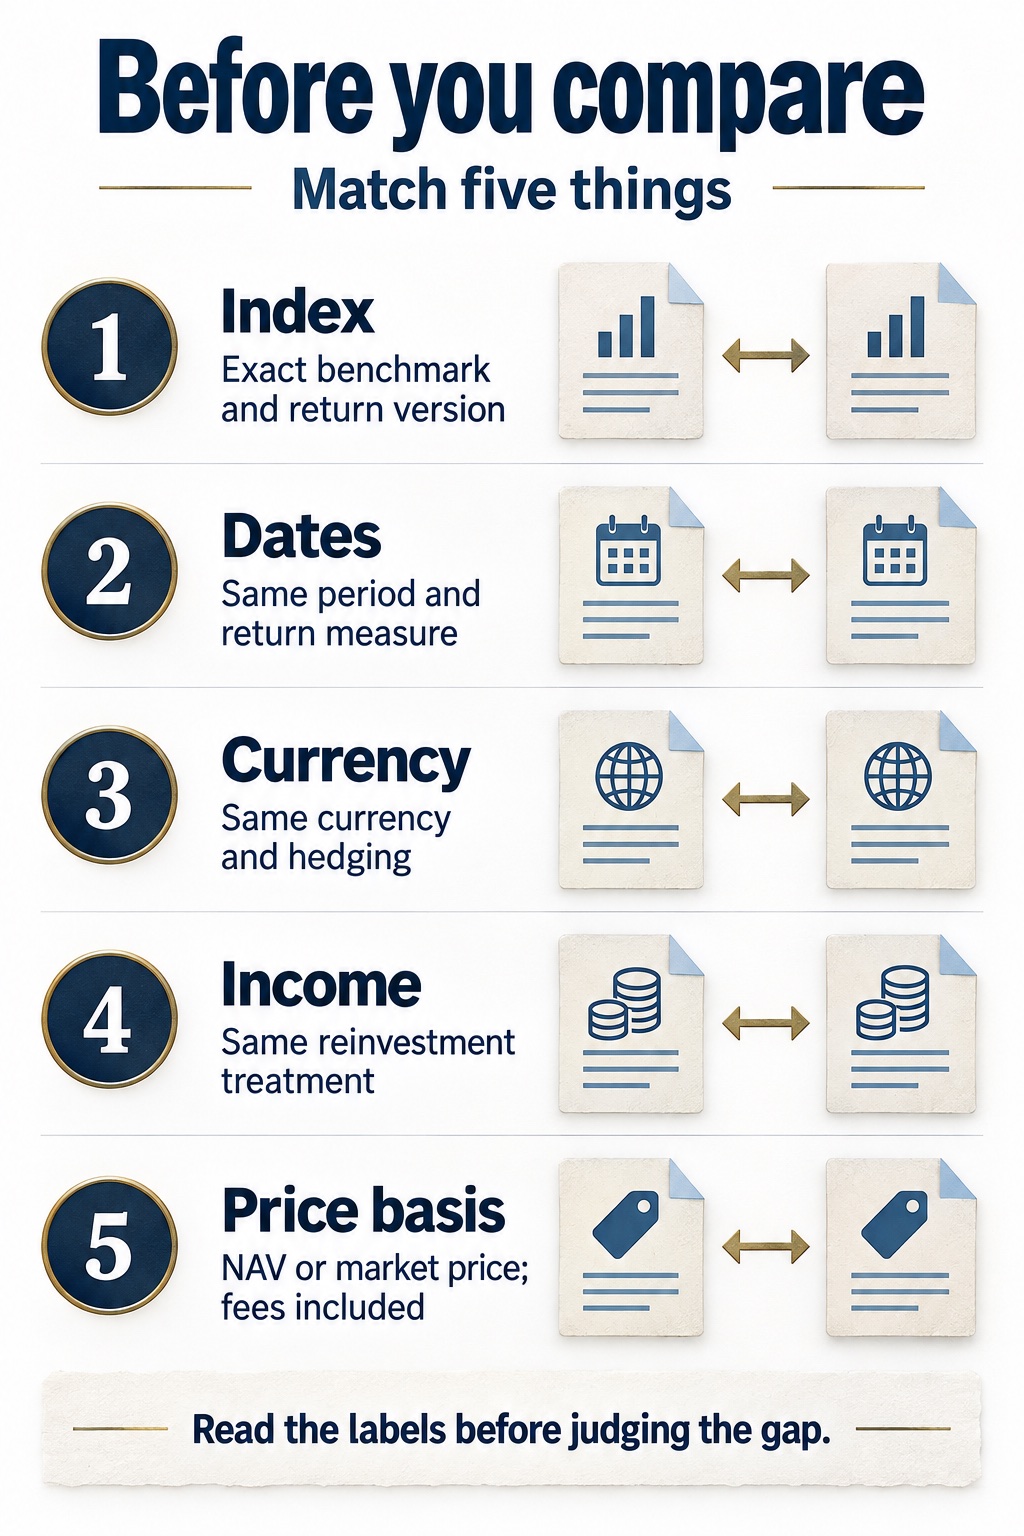
Start with the exact fund, share class and benchmark. Two funds labelled “global” may follow different markets. Our fund factsheet guide shows how to establish that identity and read the performance footnotes. Then match five things:
- The index version. A price-return index excludes ordinary cash dividends. Gross total return reinvests them before withholding tax; net total return uses the index’s withholding-tax assumptions. S&P’s methodology explains these return types. “Net” here does not mean your personal tax bill has been deducted.
- The dates and period. Compare identical start and end dates, and cumulative with cumulative or annualised with annualised. A three-year total is not a yearly rate.
- The currency and hedging. A dollar index return and a sterling fund return include different currency effects. Hedged classes aim to reduce currency exposure using financial contracts; unhedged classes do not make that adjustment. Vanguard’s currency explanation shows why the distinction matters. Paying in pounds does not itself remove overseas currency risk.
- The income treatment. Compare total returns with income reinvested, not a distributing ETF’s price-only chart against an index that reinvests dividends. A cash payout is part of the result, not missing performance. Our fund distributions guide explains that distinction.
- The price and fee basis. Net asset value, or NAV, is the value of the fund’s assets minus liabilities per share. It is not necessarily the exchange price you pay. Fidelity’s ETF pricing explanation distinguishes NAV performance from an investor’s traded return. Check which one the table uses, which fund costs are included and whether valuation times match.
What to do with an unexplained gap
Use the provider’s factsheet and fund reports, not just the line on a platform chart. Look across several comparable periods and read any explanation of realised tracking error or tracking difference. If the figure is missing or its basis is unclear, ask for it rather than estimating from a screenshot.
A useful question is: “For this share class and period, what explains the gap from its stated benchmark, and are both returns in the same currency with income reinvested?” A persistent unexplained shortfall warrants investigation. It does not automatically justify switching and incurring new costs.
Finally, keep the fund’s job in view. A tracker can follow a falling market extremely accurately. Low tracking error means consistent relative performance, not protection from losses. Check the exposure and risks first, the comparison basis second, and the return gap third. Past tracking results do not promise future results.
This article provides general financial education, not personal investment advice. Investments and their income can fall as well as rise, and you may get back less than you invest. Seek an authorised financial adviser’s help if you need a suitability assessment.