How to read a fund factsheet: a UK investor’s guide
Learn how to read a fund factsheet: check share classes, holdings, charges, performance and risk, with clear examples and a checklist for UK investors.

A fund can have an impressive performance chart and still be wrong for the job you need it to do. Learning how to read a fund factsheet starts with the small print around the numbers, not the biggest percentage on the page.
The short version
A fund factsheet is a provider’s snapshot of an investment fund, usually covering its aims, holdings, charges, performance and risks. Confirm the exact share class and document date first. Then ask what the fund owns, what it costs, how its returns were measured and what could go wrong. A factsheet helps you investigate a fund; it does not establish that the fund suits you.
Start with the right fund factsheet
Use the fund manager’s website or your investment platform to find the latest document. Aviva’s factsheet guide describes the usual sections, but layouts vary. Check the date attached to each table: a current price does not make last month’s holdings current.
The full name matters. A share class is a particular version of a fund, with its own terms. Letters such as A, I or P are provider labels, not a universal quality ranking. Match the class and, where shown, the ISIN: the identification code for that security. Two versions of the same portfolio can carry different charges.
Look for Acc, meaning accumulation, or Inc, meaning income. Accumulation units retain and reinvest income within the fund; income units normally pay it out. Hargreaves Lansdown’s fund FAQs explain the distinction. Accumulation does not necessarily give you more units: the retained income is reflected in their value.
Also check the currency. GBP on a share class is not proof that overseas currency risk has disappeared. A class explicitly described as currency hedged aims to reduce that exposure, not remove every risk. Vanguard explains how hedging works. Comparing a hedged class with an unhedged one can produce different results for reasons other than the manager’s skill.
Read the objective, then look inside the portfolio
The objective tells you what the fund is trying to achieve. Is it seeking income, long-term growth, or both? Does it track an index, select investments actively, or aim to beat a stated measure over a defined period? An aim is not a promise. A five-year objective does not guarantee that you will make money after five years.
Read the investment policy beside the objective. It explains what the manager is allowed to hold. Then inspect the asset allocation, meaning the split between assets such as shares, bonds and cash. Country and sector breakdowns show where the current exposure sits. A global label does not mean money is spread equally around the world.
Top holdings show where individual positions matter most, but they are not the whole portfolio. Check their weights, not just familiar names. If the largest ten positions account for half the fund, the remaining holdings do not make that concentration disappear. For a fund that owns other funds, you may need to look through those holdings to understand the underlying exposure.
Compare this with what you already own. Several differently named funds can hold many of the same companies. Our guide to diversification and overlapping holdings explains why a longer list of funds does not necessarily spread your risk.
Read charges as a breakdown, not one final price
OCF commonly means ongoing charges figure on existing fund documents. It covers recurring fund expenses, but should not be assumed to include every cost you will bear. Check the accompanying definition and look for separate transaction costs, performance fees and any entry or exit charges.
Your platform or adviser may charge separately. Vanguard’s fee breakdown, for example, distinguishes fund management costs from the account fee and other costs. With an exchange-traded fund, or ETF, also consider dealing charges and the spread between buying and selling prices.
Convert a percentage into pounds to understand its scale. A hypothetical annual charge of 0.30% is about £30 on a constant £10,000 holding. That is not an exact bill: the holding value changes and charges are applied over time. Nor is it the total cost if other charges apply.
UK disclosure terminology is changing. The new Consumer Composite Investments regime uses an ongoing costs figure. The FCA’s cost rules also address transaction costs, performance fees and one-off costs. During the transition, check what each figure includes before adding figures together or comparing percentages from different documents.
Compare performance on the same basis
Start with the period and the calculation, not the winner. Performance tables can show three different things:
- Cumulative return is the total change over the stated period.
- Annualised return is the equivalent compounded yearly rate over that period, not the return achieved in every year.
- Discrete annual returns show separate yearly periods, which may be calendar years or twelve months ending on another date.
Fidelity’s performance display illustrates why labels matter: separate annual periods and annualised multi-year figures appear on the same page. A three-year cumulative figure should not be compared directly with a three-year annualised figure.
Next, read the footnote. Does the return include reinvested income, often described as total return? Is it net of fund fees? Which currency and share class are used? A price-only chart for income units can miss cash already paid to investors. And if fund fees are already reflected in a net return, do not deduct them again.
Identify the comparison measure too. A benchmark might be an index the fund tracks or seeks to outperform; a sector average compares a group of funds. Some published comparisons are for context rather than a formal target. The Fundsmith factsheet, for example, distinguishes its comparators from a benchmark and identifies the class, fee basis and pricing times beneath its table. That is a useful reading habit, not a recommendation of the fund.
For trackers, our explanation of tracking difference and tracking error separates the return gap from how consistently a fund follows its index. Either way, past performance is not a reliable guide to future returns.
A worked example: 33.1% is not 33.1% a year
Imagine a fictional factsheet showing a three-year cumulative total return of 33.1%, already net of fund fees. A single £10,000 investment held for the whole period, with income reinvested and no extra account charges or cash flows, would become £13,310.
The equivalent annualised return is 10%, because £10,000 × 1.10 × 1.10 × 1.10 = £13,310. Simply dividing 33.1 by three gives 11.03%, which is not the compounded annual rate.
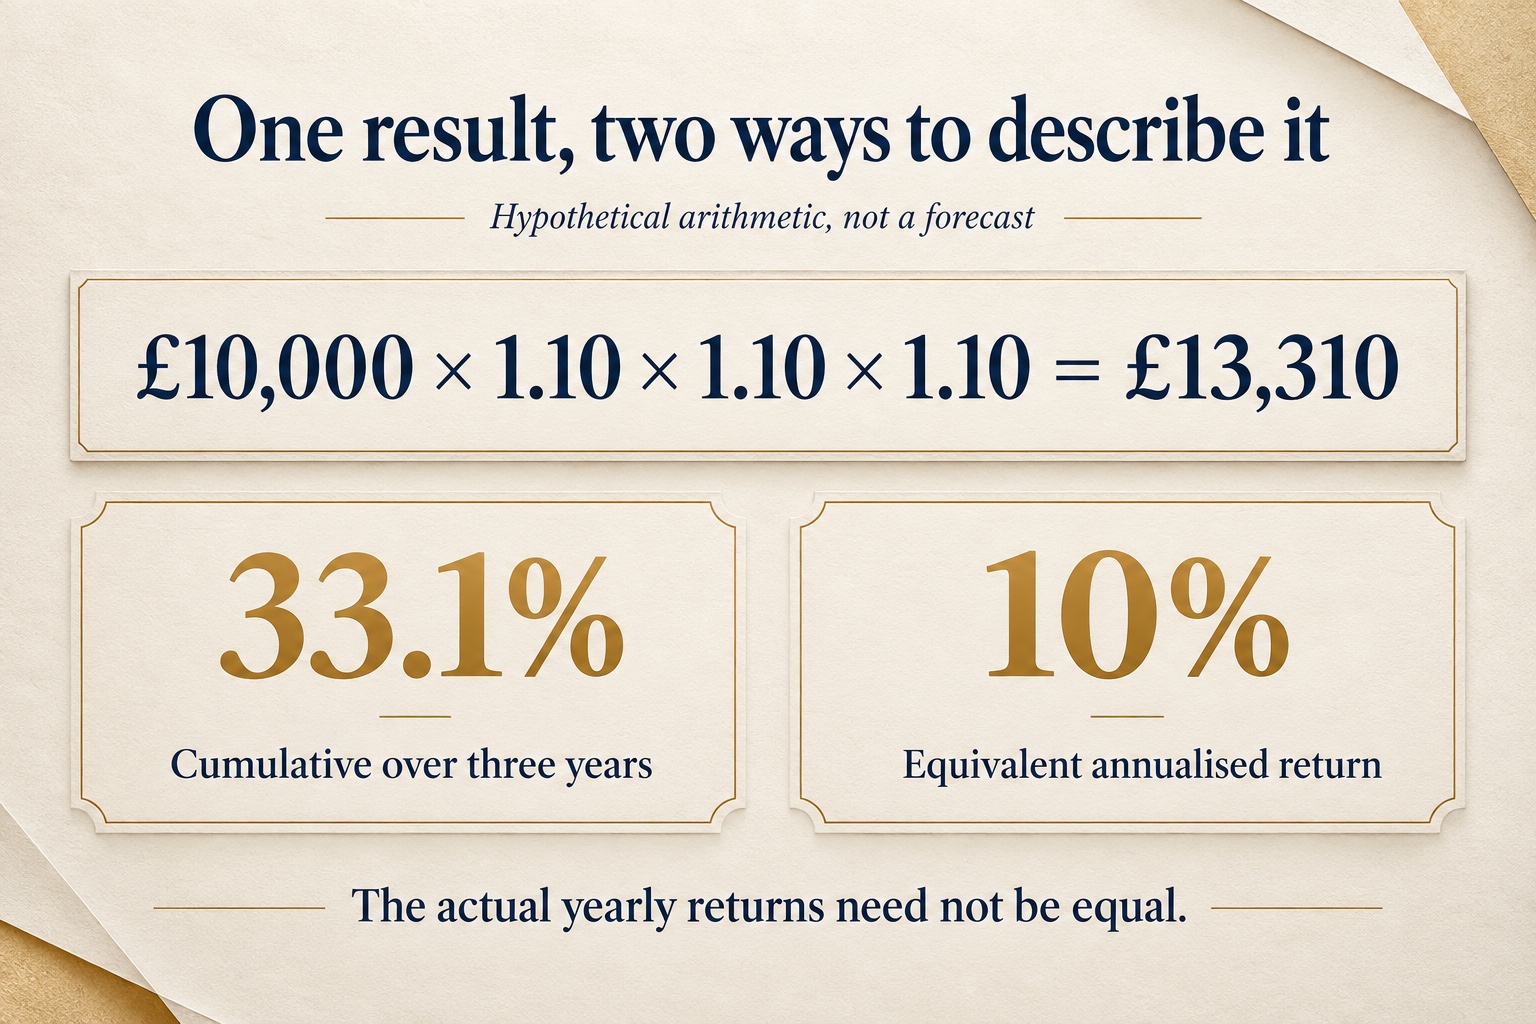
This arithmetic does not tell you the actual journey. A volatile sequence of gains and losses could reach the same final value. It also does not forecast the next three years. If you invested monthly, bought partway through the period or withdrew money, your own account return could differ from the factsheet figure.
The practical lesson is to write down the start date, end date and return basis before comparing funds. Two large percentages without those details are not yet a useful comparison.
Read the risk explanation, not just the score
A risk number summarises a method; it is not a maximum-loss percentage or a suitability verdict. Read the warnings about the assets held, currency exposure, concentration and liquidity, meaning how readily investments can be sold. A low score does not mean your capital is protected.
As at 10 September 2026, UK investors may encounter older key investor information documents, key information documents and new product summaries. Under the FCA’s transition timetable, manufacturers could start using the new product summary on 6 April 2026; the regime comes fully into force on 8 June 2027.
The new product summary uses a ten-point risk and return score, while many existing documents use seven-point indicators. Do not convert one into the other by simple arithmetic. Our fund risk ratings guide explains what these scales can and cannot tell you.
A factsheet does not replace the applicable investor disclosure document or the prospectus, which sets out fuller fund terms and risks. Follow the provider’s links to those documents before making a decision. Keep the exact class and document date consistent throughout.
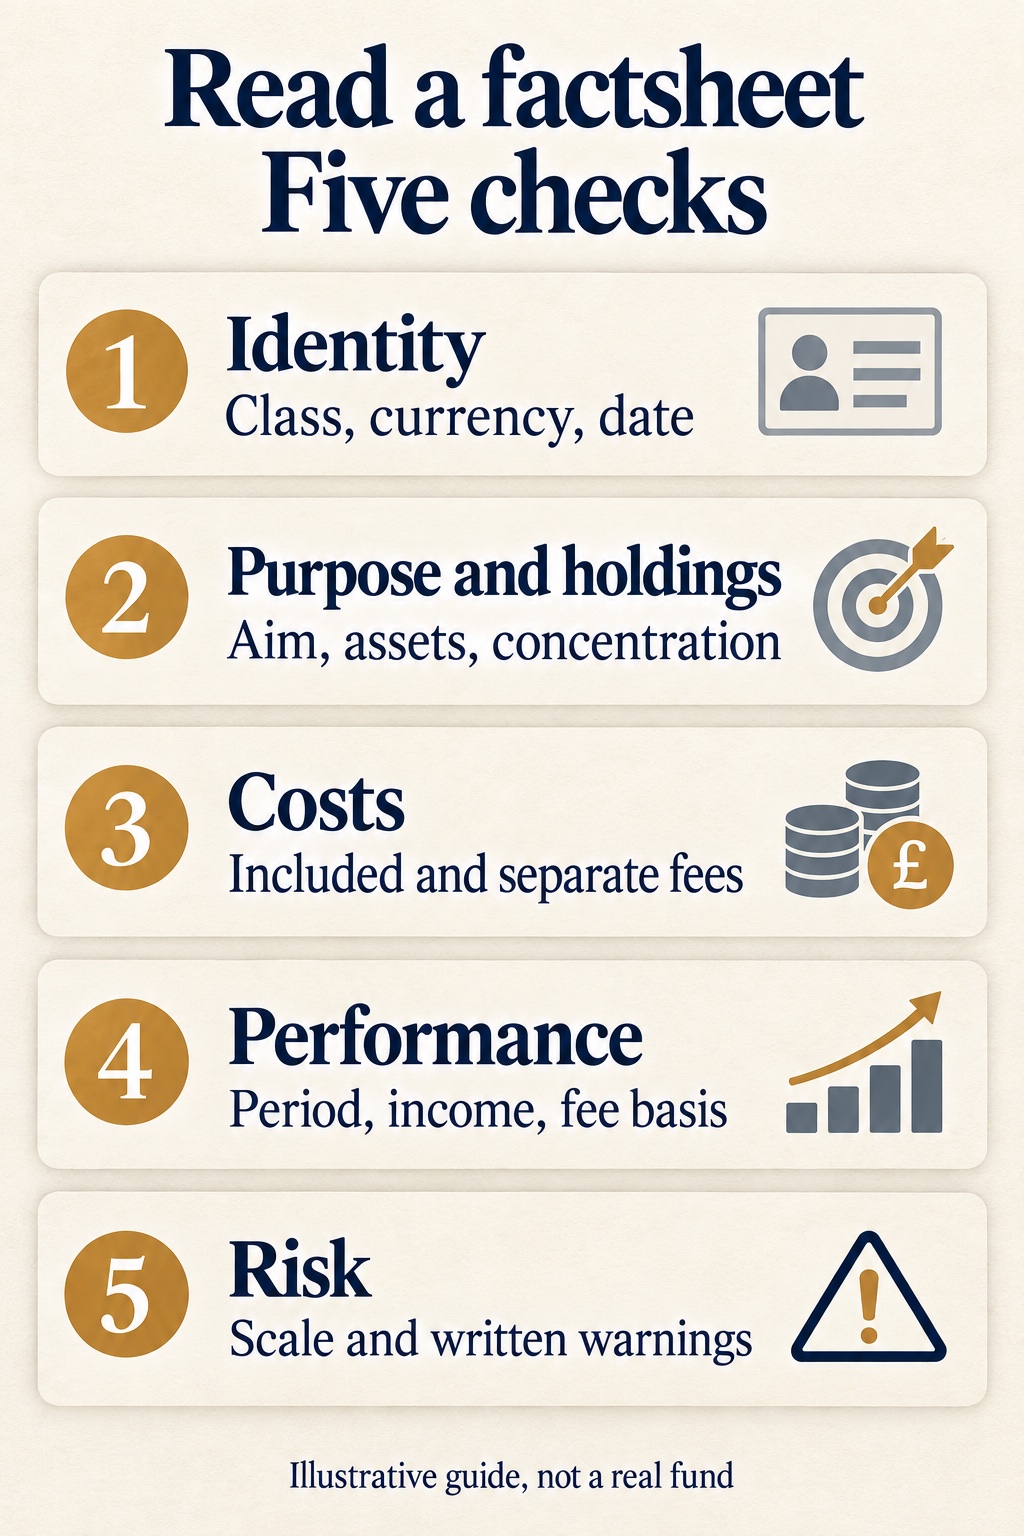
Your factsheet reading checklist
Before closing the document, make a short note with these five answers:
- Identity: the full fund and share-class name, identification code, income treatment, currency and document date.
- Purpose and exposure: what it aims to do, what it currently holds and where it overlaps with your other investments.
- Costs: what the quoted charge includes, what is separate and what your platform charges.
- Performance: the dates, return type, income treatment, fee basis and comparison measure.
- Risk: the scale used, the main written warnings and the supporting documents still to read.
If you cannot find an answer, turn it into a specific question for the provider. “Does this performance include reinvested income and which fees are deducted?” is more useful than “Is this a good fund?”
In plain English
A factsheet is a set of clues, not a verdict. Match the document to the investment, understand what sits inside it, and check the labels on every percentage. You should leave knowing what the fund is trying to do and what still needs checking, not simply remembering its best year.
This article is for general financial education, not personal investment or tax advice. Investments and the income from them can fall as well as rise, and you may get back less than you invest. If you need help judging suitability, speak to an authorised financial adviser.