Afternoon, 28 May 2026: Bitcoin steadies near $73,000 as fear holds
Bitcoin steadies near $73,000 as Extreme Fear persists. Here is the market snapshot, key coins, and what to watch for UK readers this afternoon.

Bitcoin is hovering around $73,000 (about £54,730) after a bruising overnight sell-off, and the key question this afternoon is whether the market finds a floor or stays stuck in risk-off mode. The Fear and Greed Index remains deep in Extreme Fear, which tends to coincide with forced selling and thin order books. For UK readers, this is less about predicting the next move and more about recognising the conditions: when fear is this high, prices can gap quickly on modest headlines.
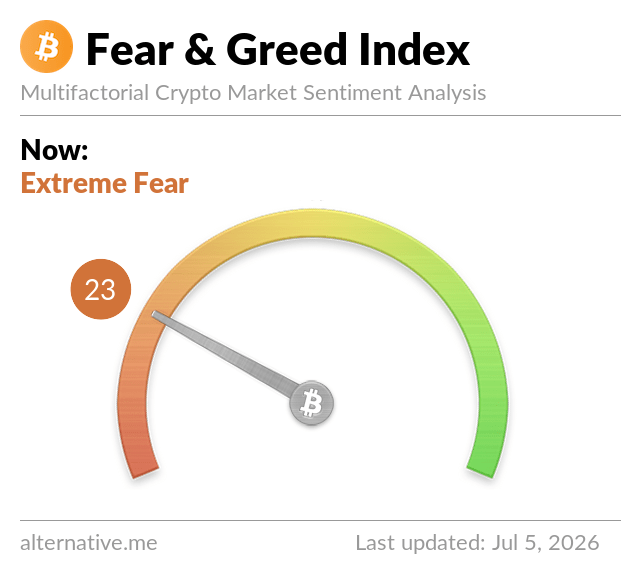
Total crypto market capitalisation sits around $2.54 trillion, down roughly 3.0% over the past day, with Bitcoin dominance near 57.9%. The Fear and Greed Index reads 22 (Extreme Fear), a sentiment gauge that blends volatility, momentum and positioning into a single number, it does not predict price but it does describe the mood.
| Timeframe | Regime | What it means |
|---|---|---|
| 1 hour | Neutral | The move has slowed. Bitcoin is trading in a tight band, which often happens after a sharp overnight drop as sellers and dip buyers pause. |
| 4 hours | Neutral | The afternoon price action looks more like stabilisation than a fresh trend. That reduces headline risk, but it does not mean the market is safe. |
| Daily | Bearish | Bitcoin is still lower than this time yesterday. Risk appetite has not returned, and rallies are being treated as opportunities to reduce exposure. |
| Weekly | Bearish | Over the past week the market has drifted down. That usually reflects macro uncertainty and weaker marginal demand rather than a single piece of news. |
| Monthly | Bearish | Over the past month the market is down modestly. The bigger story is how quickly sentiment flips when liquidity thins and leverage builds. |
Bitcoin is around $73,332 (£54,730), down about 3.0% over 24 hours. The sharp drop earlier today looked less like a single bad headline and more like a familiar mix of thin liquidity and leveraged positioning getting cleared out. When the market trades with a heavy derivatives footprint, a move through obvious levels can trigger forced selling that adds to momentum even if the original catalyst is small.
One way to frame the move is through flows. CoinDesk has reported this week that spot Bitcoin ETF demand has weakened in late May, bringing outflows back into focus. ETF data does not explain every tick, but it matters because it is one of the few visible channels where large investors add or remove exposure in size. If demand is not absorbing supply, the market becomes more sensitive to liquidations and to macro surprises.
In practical terms, the market is trying to decide whether the $72,000 to $73,000 area can act as support after the break lower. If it does, the afternoon story becomes consolidation. If it does not, the next round numbers below tend to matter simply because many traders watch them. So what: a stabilising price is helpful, but in Extreme Fear conditions it is still sensible to treat any rebound as fragile until liquidity and flows improve.
Ethereum is near $1,985 (£1,481), down about 4.3% on the day. In risk-off tape, Ethereum often underperforms Bitcoin because it sits a step further out on the risk curve. That does not make it weaker as a project, it just means it tends to move more when traders reduce exposure quickly.
The key thing to watch with Ethereum in sessions like this is whether selling is coming from long-term holders or from short-term leverage. If it is mostly leverage, you often see a sharp move lower followed by a steadying pattern as forced selling finishes. If it is longer-term allocation, the bounce can take longer because each rally meets new supply.
So what: for readers who use Ethereum as a barometer for broader crypto risk, days like today are a reminder that Bitcoin can look stable while the rest of the market quietly weakens. If you want a refresher on what liquidity means in crypto markets, it helps explain why relatively small net selling can still move prices abruptly.
Solana trades around $80.73 (£60.25), down roughly 3.5% over 24 hours. Solana tends to behave like a high beta proxy for crypto sentiment. When confidence falls, it often drops faster because traders use it as a liquid way to express risk.
The constructive way to read Solana on a day like this is not through a single narrative, but through participation. If the recovery in Bitcoin does not translate into steadier activity across major altcoins, the market is telling you that buyers are still cautious. So what: a stabilisation in Solana would be a sign that the sell-off is cooling, while continued weakness suggests fear is still spreading beyond Bitcoin.
XRP is about $1.29 (roughly £0.96), down around 3.0%. XRP can move sharply when headlines land, but in broad market sell-offs it often follows liquidity rather than news. If you see a large move without a clear catalyst, it is often positioning being reduced across the board.
So what: when the whole market is sliding together, it is usually more useful to focus on the shared driver, such as macro uncertainty or leverage, rather than trying to force a unique explanation for every coin. That is also why understanding why crypto market cap can mislead people matters, a small token can look stable in percentage terms while its market depth is thin.
BNB is near $631 (£471), down about 3.4% over 24 hours. BNB often trades as a mix of exchange-linked sentiment and general risk appetite. In sell-offs, it typically behaves like a large-cap altcoin, moving with the pack unless there is exchange-specific news.
So what: if you want to reduce noise in a fast session, treat BNB, Solana and similar large-cap tokens as temperature checks for market confidence. When they stop falling on bad tape, it can be a sign that forced selling has eased.
The broader theme this afternoon is not one coin, it is the market’s sensitivity to macro data and visible flow indicators. US inflation data and growth numbers due later today matter because crypto has increasingly traded like a macro asset: when rate expectations shift, risk appetite shifts with it. That does not mean every move is driven by economics, but it does mean the market can react quickly to a surprise print.
The Fear and Greed reading at 22 is a good illustration of the mood. Extreme Fear does not automatically mean a bottom, it means participants are defensive. In that environment, even normal volatility can feel dramatic, and the cleanest sign of improving conditions is usually a drop in liquidation pressure and a return of steady spot buying.
If you are trying to understand why prices can move so sharply without a single headline, it helps to separate the market structure from the story of the day. For example, learning how decentralised exchanges work can clarify how liquidity fragments across venues, and why price discovery can be jumpy when volumes thin.
What to watch next is whether Bitcoin can spend time above the low $73,000s without another cascade, and whether the next macro print changes the tone. If Bitcoin holds this area through the US data window, it would suggest the market has absorbed a chunk of selling. If it breaks lower again, the psychological levels below tend to draw attention simply because many stop losses and re-entry plans cluster there.
For the rest of the market, Ethereum holding the $2,000 area is a similar sentiment marker. A quick reclaim and stabilisation would point to leverage being cleared. A continued grind lower would look more like risk reduction. Either way, the important point is not to over-interpret a single hour: in Extreme Fear conditions, the market can swing from panic to calm and back again.
Crypto Daily is Cristoniq’s afternoon update on cryptocurrency markets, published every weekday for informational purposes only. Nothing here is financial advice. Always do your own research before making any investment decisions.