20 May 2026: Bitcoin’s Grip on the Market Tightens as Dominance Hits 58%
Bitcoin holds near $77,000 as dominance reaches 58%, the Fear and Greed Index sits at 27, and the $76,000 May bull market threshold stays in focus.

Crypto markets have spent this Wednesday afternoon finding their footing, with Bitcoin holding just above $77,000 after a week-long retreat from $82,000 that has left sentiment firmly in Fear territory. The story of the afternoon is not so much where prices have moved as where the money has not gone: away from Bitcoin. Dominance is at 58%, a level not seen since July last year, and that concentration tells you something about the mood in the market right now.
The total crypto market cap sits at approximately $2.65 trillion. Bitcoin accounts for 58.34% of that figure, close to the highest reading since July 2025. When dominance climbs toward that level, it generally reflects a market leaning on Bitcoin as a relatively familiar anchor while staying cautious about the wider altcoin universe. The Altcoin Season Index is at 39 out of 100, in what data trackers classify as Bitcoin Season, meaning Bitcoin is outperforming the majority of the top 100 coins over the past 90 days.
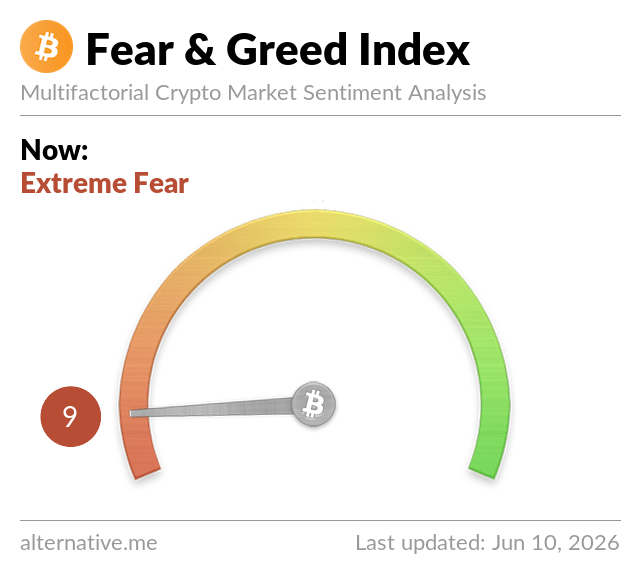
The Fear and Greed Index sits at 27 today, a reading in Fear territory. The index pulls together signals from price momentum, market volume, social media activity, and other sentiment indicators, then converts them into a single number between 0 and 100. A reading of 27 means the market is leaning cautious and defensive, though it is worth being clear: the index records the prevailing mood, not where prices are headed.
| Timeframe | Regime | What it means |
|---|---|---|
| 1 hour | Neutral | Bitcoin is drifting sideways, with no strong intraday momentum in either direction |
| 4 hours | Neutral | Price has been oscillating in a narrow band around $77,000, with buyers and sellers broadly matched |
| Daily | Neutral | A slight recovery from yesterday’s low of around $76,808, but not yet a confirmed directional move |
| Weekly | Bearish | Bitcoin has fallen roughly 4.6% over the past seven days, from around $81,050 to current levels |
| Monthly | Neutral | Bitcoin remains above early-May levels, broadly flat over the month but with significant intra-month volatility |
Bitcoin is trading at around $77,344 (approximately £57,720), up roughly 0.9% over the past 24 hours, a modest recovery from yesterday’s low of around $76,808 but still well below the $82,000 high reached on 14 May.
That high came on the back of a specific event. The US Senate Banking Committee advanced the Clarity Act in a 15-to-9 bipartisan vote, a bill designed to establish a clearer legal framework for digital assets in the United States. Crypto markets reacted sharply, reading the vote as evidence that meaningful regulation might actually arrive. The rally was swift, and so was the reversal: within a day, rising US Treasury yields and fresh inflation data rattled global risk markets, and Bitcoin dropped back toward $79,000. It has continued to ease through this week, settling in the $77,000 range.
One number is worth keeping in focus for the rest of May. Tom Lee of Fundstrat, one of the more prominent Bitcoin analysts in US markets, noted earlier this month that closing May above $76,000 would confirm a third consecutive monthly gain, which he characterised as a signal of a new bull market. Bitcoin is currently sitting around $1,300 above that threshold with about ten days remaining. It is a narrow cushion, and it helps explain why the $76,000 to $77,000 zone has attracted attention as a support level. For context on what bull and bear markets mean in crypto, Cristoniq’s guide to crypto bull and bear markets has the full picture.
Ethereum is trading at around $2,127 (approximately £1,587), up roughly 0.8% over the past 24 hours, a small positive move that reflects the broader market tone rather than any Ethereum-specific catalyst.
What makes Ethereum’s position notable is not the price itself but where it sits relative to Bitcoin. The ETH/BTC ratio has been compressing steadily, which means Ethereum is not keeping pace with Bitcoin even in sessions when both assets are positive. This is one of the cleaner expressions of high dominance in practice: capital that might in another environment be spreading toward layer-one alternatives is instead staying concentrated in Bitcoin. Ethereum’s technical progress, including its proof-of-stake transition and expanding layer-two ecosystem, is genuine, but not sufficient right now to shift capital flows while broader sentiment sits in Fear territory.
XRP is trading at around $1.36 (approximately £1.02), down about 0.5% over the past 24 hours, making it the only major coin in modest decline across this afternoon’s session.
XRP’s slight underperformance follows an extended period in which it outpaced the wider market, driven by regulatory optimism following the resolution of the Ripple SEC case. That news has been fully priced in for some time now, and without a fresh catalyst, the token has been consolidating in a narrowing range. At around $1.36, XRP is well above its 2025 lows, but the absence of a new driver is keeping buyers on the sidelines.
Solana is trading at around $84.63 (approximately £63.15), up roughly 0.3% on the day, effectively flat in a session that has produced no strong directional signal for the altcoin space.
Solana attracted meaningful institutional attention during 2025, with several asset managers filing for Solana-based ETF products in the United States. Those applications are still working through regulatory channels, and uncertainty around approval timing has kept some institutional buyers at a distance. At current prices, Solana is well off the cycle highs it reached last year, and the current environment of high Bitcoin dominance and subdued sentiment is not one that typically produces sharp altcoin recoveries.
Bitcoin’s dominance reading of 58.34% is among the highest since July 2025, and the pattern behind it is worth understanding clearly. Bitcoin dominance measures Bitcoin’s share of the total crypto market cap: when it rises, Bitcoin is either growing faster than altcoins or falling more slowly. In the current environment, the latter is the more likely explanation. Capital that might in another cycle phase be rotating into smaller coins is instead sitting in Bitcoin or leaving the crypto market altogether.
The Clarity Act context matters here. Regulatory clarity has been one of the most consistently cited reasons why institutional investors have stayed cautious about altcoins, even when willing to hold Bitcoin via ETF products. Bitcoin has a relatively clear regulatory status in the United States; most altcoins do not. If the Clarity Act eventually establishes clearer rules for the broader digital asset market, it could shift the picture for altcoins materially. But the legislative path from committee approval to a signed bill takes months, and crypto markets have a history of pricing in regulatory progress too early. The Senate Banking Committee vote on 14 May was a genuine step forward. It was not a finish line.
The most specific level to track over the next ten days is $76,000. Bitcoin closing May above that figure would, by Fundstrat’s reading, signal a confirmed new bull market based on three consecutive monthly gains. With Bitcoin at $77,344, the cushion is real but modest. A move back toward $76,000, which could come from another round of US macroeconomic data unsettling risk markets, would bring that threshold sharply into focus.
The Clarity Act’s legislative progress beyond the committee stage is the regulatory catalyst to watch. A Senate floor vote date being announced would likely produce a market reaction similar to, though probably smaller than, the one seen on 14 May. A delay or setback would apply modest downward pressure, particularly to Bitcoin and Ethereum, which have benefited most from US regulatory optimism over the past year.
The Fear and Greed reading at 27 is approaching Extreme Fear territory, which begins at 25. A further deterioration below that level would indicate a meaningfully more cautious market mood. Historically, Extreme Fear readings have sometimes coincided with short-term price floors, but macro conditions, particularly US inflation and bond market dynamics, have been the dominant force this month and can override historical crypto sentiment patterns.
Crypto Daily is Cristoniq’s afternoon update on cryptocurrency markets, published every weekday for informational purposes only. Nothing here is financial advice. Always do your own research before making any investment decisions.