16 May 2026 PM: Ethereum Slips to $2,175 as Spot Bitcoin ETFs Shed $1bn for the Week
Bitcoin holds $78,000 as Ethereum slips to $2,175 and spot Bitcoin ETFs log a $1bn weekly outflow, snapping a six-week run of inflows.

Saturday afternoon has settled into a broad sell-off across crypto markets, with Bitcoin holding above $78,000 while Ethereum, Solana and Chainlink lead the move lower. The catalyst sits firmly in the ETF column: Friday’s $290m net outflow capped a week in which spot Bitcoin funds shed roughly $1bn, breaking a six-week inflow streak that had carried prices through April.
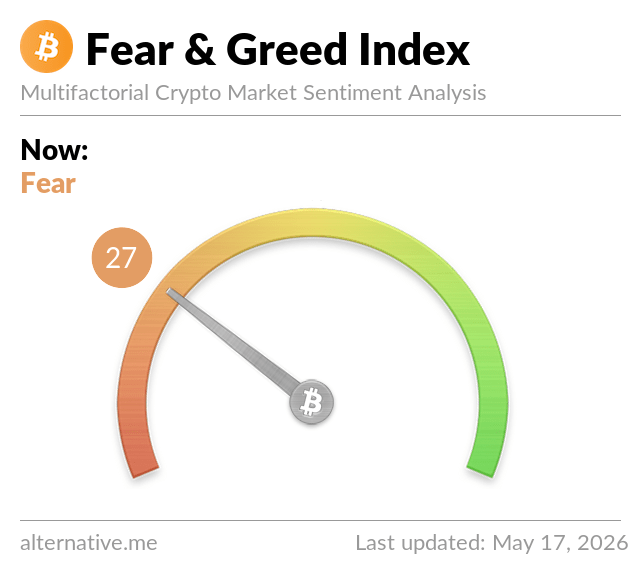
The market is down across the board, but the speed of the sentiment turn is what stands out. The Fear and Greed Index, which blends price momentum, social media volume and survey data into a single sentiment score, has fallen to 31 in Fear territory from a Neutral 43 reading just twenty-four hours ago. That kind of one-day move usually follows either a sharp drawdown or a clear macro shift, and today’s session contains a bit of both: weekend liquidity is thin, the ETF flow data published after Friday’s close was the worst weekly print since March, and the Fed’s commitment to just one rate cut across 2026 is back in focus.
Total crypto market capitalisation sits at roughly $2.68 trillion, down around 3.1% on the day. Bitcoin dominance has nudged up to 58.4%, the natural shape of a session in which altcoins fall faster than Bitcoin, and Ethereum’s share of the total has slipped under 9.8%. The Fear and Greed reading is doing exactly what it is designed to do, marking a meaningful change in tone, but it remains a sentiment snapshot rather than a forward indicator.
| Timeframe | Regime | What it means |
|---|---|---|
| 1 hour | Neutral | Bitcoin is flat over the past hour after the morning drop, with most majors stabilising in a tight range. |
| 4 hours | Bearish | The afternoon leg has been one-directional. Altcoins have given back any overnight bounce attempts. |
| Daily | Bearish | A broad 3% drawdown in market cap, with no major coin holding green over twenty-four hours. |
| Weekly | Bearish | Bitcoin is down around 2.9% over seven days. Ethereum, Solana and Chainlink are all down 6% to 8%. |
| Monthly | Neutral | The April rally has unwound only partially. Bitcoin still trades well inside its 30-day range. |
Bitcoin is trading at around $78,026, down approximately 3.1% over the past twenty-four hours, with the move concentrated in the European morning and the US pre-open. The relevant level on the chart is $78,000 itself, which has held repeatedly across May as the lower bound of the post-April range. A clean break below it, particularly on a session with confirmed ETF outflows, would expose the next zone around $76,000, and beneath that the more important $74,300 area that aligns with the late-March consolidation. In sterling, today’s print equates to roughly £62,000 per coin.
The flow data is what reframes the move. Spot Bitcoin ETFs in the United States ended a nine-day inflow streak on Friday with $290m of net redemptions, bringing the full-week tally to roughly $1bn out. That ends a six-week run of weekly inflows and represents the largest weekly outflow since February. It does not on its own indicate a structural change in institutional appetite, but it does suggest the marginal allocator is now waiting for a clearer macro signal before adding. ETF flows are not the only buyer in this market, but they have been the steadiest one across 2026, and a week of net selling from that cohort matters more than the same dollar value coming out of perpetuals.
Bitcoin is holding the level it needs to hold, but the buyers have stepped back rather than stepped in.
Ethereum is trading at around $2,175, down 3.6% over twenty-four hours and approximately 6% over the week. Ethereum’s weakness is not just a function of the broader sell-off. The asset has consistently underperformed Bitcoin since the start of May, and the spread between the two has widened to its most negative reading in roughly six weeks. The drivers are familiar: weaker spot ETF flows than the Bitcoin equivalent, sustained competitive pressure from rival layer-one networks on transaction activity, and a macro backdrop in which a slower Fed cutting path leans harder on assets further out on the risk curve.
The $2,150 area is the proximate support to watch. Ethereum has bounced off that zone twice in the past three weeks, and a third visit on heavier volume would change the tone. Until the ETH and BTC flow picture diverges in Ethereum’s favour, rallies in ETH will keep looking like sales.
Solana is at around $86, down 5.7% on the day and 8% over the week, making it the worst performer among the top ten over the seven-day window. The narrative around Solana has cooled noticeably from the start of the year. Network activity remains strong by any historical comparison, but the marginal flow that drove the asset to $200 in 2025 has not returned in size, and weekend sessions, when retail participation drives a larger share of volume, are exposing that gap. Some of today’s move is also mechanical, with leveraged perpetual positions getting unwound as the daily candle turned red across most majors. Solana looks like the cleanest expression of the current risk-off shift in altcoins, which makes the $85 level the one to watch into Sunday.
Chainlink and Avalanche are both down between 5% and 6.5% on the day, leading the mid-cap declines. Chainlink at $9.65 is now a clear 7.8% below its level a week ago and is testing horizontal support in the $9.50 zone that has acted as a floor since mid-April. Avalanche at $9.25 has broken that same level intraday and is the more vulnerable of the two from a technical standpoint. Neither has had any coin-specific catalyst in the past forty-eight hours, which makes their underperformance a useful read on broader altcoin sentiment: in a session where there is no particular reason to single out a name, the names that fall hardest tend to be the ones with the weakest bid underneath. Altcoin beta is back in control, and that rarely turns until Bitcoin’s flow story does.
XRP at $1.41 is down 4% on the day but essentially flat across the week, and BNB at $653 has held a positive seven-day return despite today’s slide. These two are worth noting because they are not behaving like the rest of the altcoin complex. XRP’s steadiness reflects the absence of any fresh negative catalyst on the regulatory side, and the cross-border payments narrative that has anchored the token through 2026. BNB’s positive weekly return owes more to its discount programme and exchange flows than to any broader market dynamic. Neither is a buy signal, but their relative strength is a useful contrast to the deep red elsewhere on the leaderboard.
The story worth sitting with this afternoon is the ETF flow reversal itself, because it changes the macro tape that has supported crypto for most of 2026. The six-week inflow streak that ended this week had pulled roughly $5bn into spot Bitcoin funds, and that flow had become the cleanest single explanation for Bitcoin’s behaviour relative to global risk assets. Strip it out, even temporarily, and you are left with a market that has to make its own case on the basis of fundamentals, macro positioning and weekend liquidity. For more on how ETF flows have shaped this cycle, our Crypto Decoded archive covers the mechanics in detail.
The other piece of context is the Fed. The market’s implied path for rate cuts in 2026 has moved closer to the central bank’s own projection of one cut, after several months of pricing in two or three. That repricing weighs hardest on the assets furthest out on the risk curve, which is why altcoin underperformance today is consistent with the macro tape rather than a surprise within it. Readers who want the morning’s framing of the same setup can revisit our earlier update, which covered the opening of this weekend’s slide.
What to watch as the afternoon turns into the European evening. First, Bitcoin’s daily close around $78,000: a decisive break below that level on a Saturday, with no ETF flow data to confirm or contradict the move, would set up a more defensive Monday open. Second, the $2,150 support in Ethereum: a flush through that zone before US futures reopen on Sunday would shift the conversation from underperformance to capitulation. Third, the Sunday evening tape itself, when weekend ranges in crypto often hold until the Asia open at around 22:00 UK time. Finally, the next Fear and Greed print tomorrow: a move below 25 would mark the deepest fear reading in more than six weeks, though it remains a sentiment marker rather than a buy signal.
Crypto Daily is Cristoniq’s afternoon update on cryptocurrency markets, published every weekday for informational purposes only. Nothing here is financial advice. Always do your own research before making any investment decisions.