14 May 2026 PM: Bitcoin Steadies Near $79,000 as Solana Pares Earlier Losses
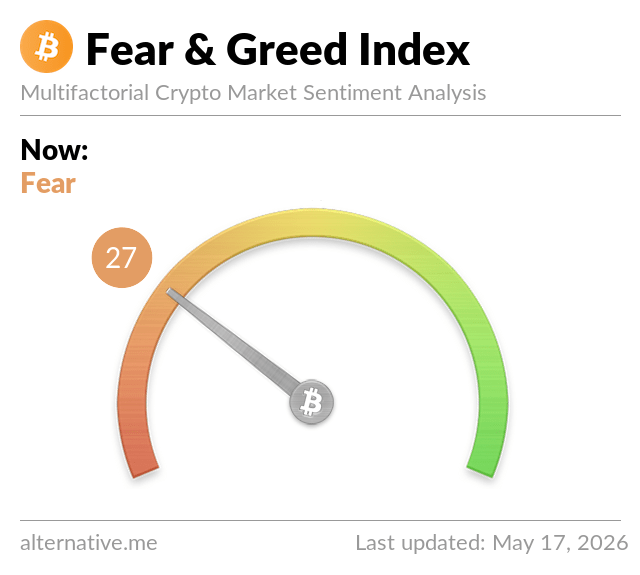
Bitcoin steadies near $79,000 in Thursday afternoon trading as Solana pares its earlier 5% slide. The Fear and Greed Index sits at 34, in Fear territory.

The afternoon has not delivered a recovery, but it has not delivered an extension of the morning’s selling either. Bitcoin is steady near $79,000, Solana has pared a chunk of its earlier 5% slide back to roughly 4%, and the Fear and Greed Index has not budged from 34. After Thursday’s anxious open, the story of midday trading is a market that has simply stopped moving.
The total crypto market capitalisation sits at approximately $2.73 trillion, down around 1.5% over the past 24 hours. Bitcoin dominance, which measures Bitcoin’s share of the total market, sits at 58.1%, an elevated reading that typically signals investors are concentrating in Bitcoin while pulling back from smaller coins.
The Fear and Greed Index, which aggregates signals from price momentum, trading volumes, social media activity, and market surveys to produce a single sentiment reading, remains at 34, in Fear territory. The reading is unchanged from this morning’s update and below yesterday’s 42. The index is a snapshot, not a predictive tool, but the persistence of Fear readings through this week points to a market that has settled into cautious trading rather than one preparing to capitulate.
| Timeframe | Regime | What it means |
|---|---|---|
| 1 hour | Bearish | Price drifting lower in the current session with no meaningful bounce. |
| 4 hours | Neutral | Bitcoin trading in a narrow range between roughly $78,800 and $79,500. |
| Daily | Bearish | Bitcoin is down around 1.5% on the day, again failing to reclaim $80,000. |
| Weekly | Bearish | Bitcoin is down around 2% over the week, with $80,000 acting as a consistent ceiling. |
| Monthly | Neutral | The broader trend remains indeterminate, with prices oscillating between roughly $75,000 and $85,000. |
Bitcoin is trading at around $79,260, down approximately 1.5% over the past 24 hours and roughly 2% over the past week, with the $80,000 level continuing to act as a ceiling on every attempted move higher.
The morning session covered in our AM update noted Bitcoin’s inability to reclaim $80,000 as the defining feature of this phase of the market. That has not changed by midday. Price has spent the past several hours in a narrow range between roughly $78,800 and $79,500. In sterling terms, Bitcoin trades at approximately £58,700, broadly flat on the day.
The lack of intraday volatility is itself notable. When Bitcoin moves only fractions of a percent over a six-hour stretch, it tends to signal one of two things: an absence of buyers willing to step in at current levels, or an absence of sellers willing to push prices further down. Both can be true at the same time. The result is the kind of quiet, sideways tape that often precedes either a fresh leg lower or a bounce, depending on which side gives way first.
So what: a market that refuses to bounce after multiple sessions of weakness is not the same as a market that is breaking down. But it is not a market that has found a floor either.
Ethereum is trading at around $2,253, down approximately 2.1% over the past 24 hours and 3.3% over the past week, making it the weakest performer among the top three by market cap.
Ethereum’s underperformance has been a steady theme of recent sessions. The pair against Bitcoin has continued to grind lower as institutional flows have favoured Bitcoin ETFs over their Ether counterparts. The narrative around real-world assets and tokenisation, while real, has not translated into the price action that bulls were pointing to at the start of the year. For why tokenisation is a longer-term story rather than a near-term price catalyst, our explainer on why banks are interested in tokenisation sets out the timelines and the actual flows involved.
So what: until ETF flows shift or the ETH/BTC ratio finds a floor, Ethereum is likely to underperform in risk-off sessions and lag in risk-on ones.
Solana is trading at around $90.60, down approximately 4% over the past 24 hours but up roughly 1.7% on the week, after paring back from a deeper 5% decline in the morning session.
This morning’s update flagged Solana as the steepest decliner among major coins. Six hours later, that picture has softened. Solana has not recovered the day’s losses, but it has recovered roughly a percentage point of them, which suggests the morning’s selling was the worst of it rather than the start of a fresh leg lower.
The weekly chart still has Solana in positive territory, a reminder that single-session moves can mask a broader trend. A coin that is down 4% today but up nearly 2% on the week is not unwinding; it is consolidating. Where Solana goes from here probably depends on whether risk appetite returns to crypto more broadly. Solana’s price is largely a beta play on the wider market right now.
So what: Solana’s pullback from the morning’s lows is a small piece of evidence that today’s selling was sentiment-driven rather than something deeper.
BNB is trading at around $670, down approximately 1.1% on the day but up around 3.6% over the past week, making it the standout weekly performer among the large-cap coins.
BNB’s relative strength this week is the kind of detail that is easy to miss when the broader narrative is about Bitcoin and Ethereum. The Binance-linked token has held up better than its peers through this stretch of selling, supported by steady exchange volumes and a continuing buyback programme that has reduced supply over time. When one of the top five coins decouples from the broader move, it is worth paying attention to.
So what: the decoupling does not always last, but it points to something specific going on with that token rather than a blanket judgement on crypto.
XRP is trading at around $1.43, down approximately 1.1% on the day but up around 1.7% on the week, holding most of its recent gains despite the broader pullback.
XRP has been one of the better behaved large caps through this period of market weakness. The token has settled into a range between roughly $1.40 and $1.50, with neither side pushing through with conviction. The Ripple legal picture remains stable, which removes the kind of headline risk that defined the asset’s trading for years.
So what: XRP is no longer a regulatory story; it is a payments story. Whether that translates into sustained price strength depends on whether institutional payment flows actually scale.
The interesting feature of Thursday’s market is not that prices are down. It is that the moves are not uniform. Bitcoin is off 1.5%, Solana is off 4%, BNB is essentially flat on the day, and Dogecoin and Tron are both up small amounts. That pattern, where the headline number says markets are down but the individual coins are telling different stories, is the kind of dispersion that builds when sentiment is the main driver rather than a specific catalyst.
Dispersion matters because it tells you what kind of selling this is. When markets capitulate, correlations between coins tend to rise toward 1, and everything sells off together. Today is the opposite. Coins are being judged on their own merits, or at least on their own short-term flows. The most plausible reading is that traders are reducing exposure to the highest-beta names while leaving the more stable large caps relatively intact, a pattern consistent with the 58% Bitcoin dominance figure noted earlier.
The most important data point in the coming days is the US producer price index reading scheduled for release on Friday, followed by retail sales figures next week. Crypto markets have proved sensitive to US inflation and consumer data in recent months because of the implications for Federal Reserve interest rate policy. A higher than expected reading on either could put renewed pressure on risk assets including Bitcoin; a softer reading would likely give the Fear and Greed Index room to climb back toward Neutral.
On the charts, three things to watch. First, whether Bitcoin reclaims the $80,000 level on a closing basis. A daily close above $80,000 would be the first technical signal that the recent weakness has spent itself. Second, whether the $78,000 level holds on any fresh weakness; a daily close below would shift the technical picture meaningfully. Third, whether Solana’s morning low at roughly $88 is retested.
A final thing worth watching is the Fear and Greed Index itself. It has now spent several consecutive sessions in the 30s. A move below 30 would push it into Extreme Fear territory, which has historically coincided with points where contrarian buyers have stepped in. A move back above 45 would suggest the cautious mood is starting to lift.
Crypto Daily is Cristoniq’s afternoon update on cryptocurrency markets, published every weekday for informational purposes only. Nothing here is financial advice. Always do your own research before making any investment decisions.