Crypto Daily 16 Apr: Bitcoin Stalls Below $75K Amid Fear
Bitcoin held near $74,900 on Thursday as total market cap climbed to $2.62 trillion, yet the Fear and Greed Index stayed stuck at 23. Here is what the gap means.
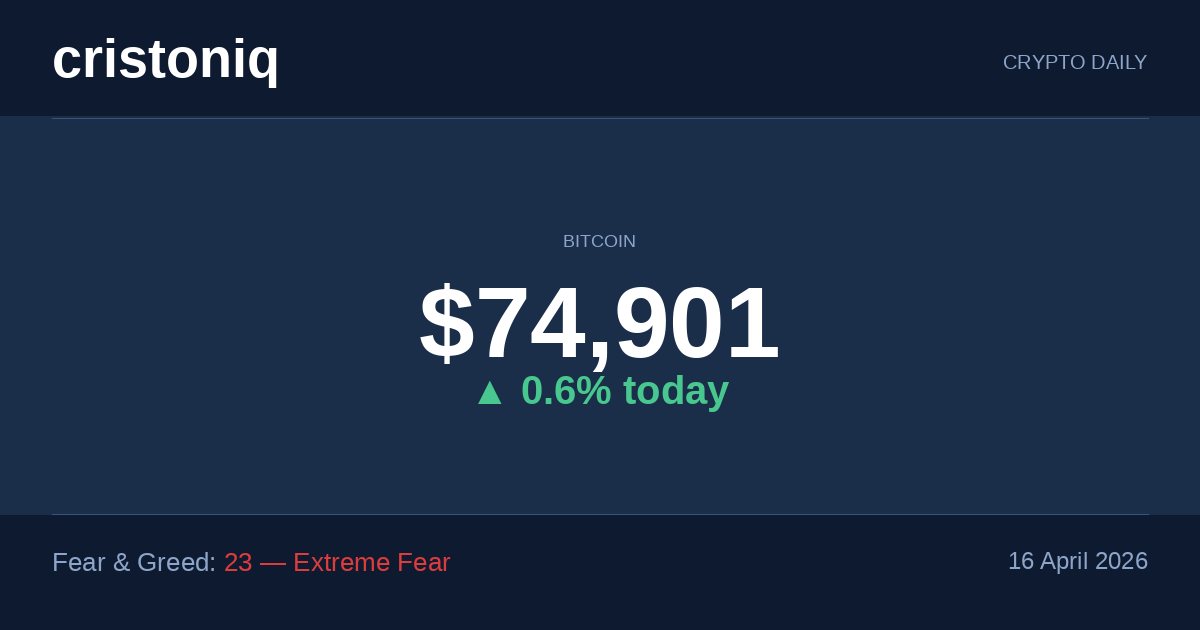
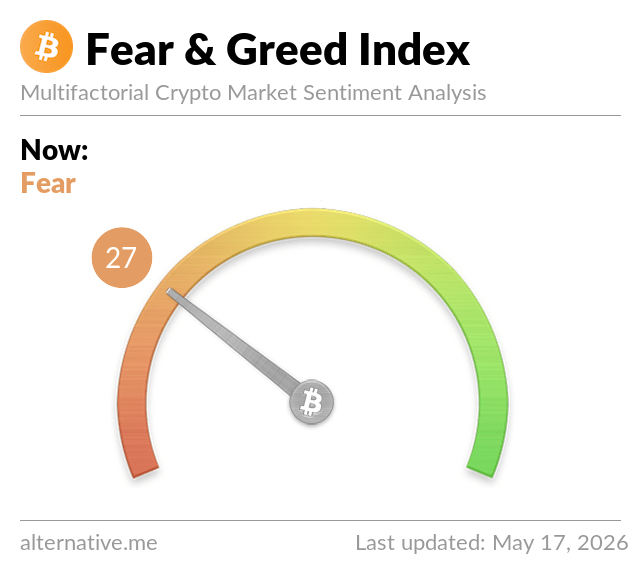
Bitcoin traded within a whisker of $75,000 on Thursday morning, up 0.6% over 24 hours, while Ethereum added 1.1% and XRP led the large-cap pack with a gain of 3.6%. Every major token in the top five is green on the week by more than 3%, and total crypto market capitalisation has climbed back to $2.62 trillion (around £2.07 trillion). The one thing refusing to cooperate with the recovery is the Alternative.me Fear and Greed Index, a composite sentiment score that aggregates volatility, momentum, social media signals and surveys, which is sitting at 23 out of 100, firmly in Extreme Fear territory. Prices rising while sentiment stays pinned near the floor is not a contradiction to explain away. It is the dominant story right now.
Total crypto market capitalisation stands at roughly $2.62 trillion, up 0.93% over 24 hours, but overall trading volume fell more than 20% in the same window. Higher price on lower volume suggests the move is orderly rather than demand-driven. Bitcoin’s market dominance, the share of total crypto value held in BTC versus all other assets, sits at 57.24%, with Ethereum at 10.87%. Capital is not rushing aggressively down the risk curve. This looks less like a fresh altcoin season and more like a cautious re-risking led by the largest and most liquid names.
| Timeframe | Regime | What it means |
|---|---|---|
| 1 hour | Neutral | Bitcoin is holding above short-term support but the last few hourly candles are flat and volume has faded after the earlier push. |
| 4 hours | Bullish | Price is above its 20 and 50-period four-hour averages, with a structure of higher lows still intact from the recent rebound. |
| Daily | Bullish | Bitcoin is trading clearly above its 20-day and 50-day averages, with weekly momentum positive and support holding in the low-$73k to mid-$74k zone. |
| Weekly | Neutral | The weekly bounce is constructive, but Bitcoin still sits below the 20-week average and well below the post-peak area, so the broader recovery remains incomplete. |
| Monthly | Neutral | Long-term structure is not broken, but Bitcoin is still below the 20-month average, which argues for consolidation rather than a clean macro breakout. |
Bitcoin is at $74,901 (roughly £59,200), up 0.63% on the day and 5.4% on the week. The daily and four-hour charts are both constructive: price is above its 20-day and 50-day moving averages, and short-term structure still shows higher lows building from the recent rebound. The weekly and monthly timeframes are both neutral, with Bitcoin below its 20-week average and some distance from the levels it held before the post-peak correction earlier this year.
Binance perpetual funding for BTC is slightly negative at around -0.022%, meaning the market is currently paying short sellers a small premium to hold their positions rather than rewarding buyers. Research firm K33 noted this week that the 30-day average funding rate has been negative for 46 consecutive days, a duration that mirrors the stretch at the 2022 bear market bottom before the subsequent recovery. On-chain analytics firm CryptoQuant offered a counterpoint, flagging a jump in exchange inflows that historically precedes profit-taking. Both readings draw from real data. The market is staging a live test of which is correct, and $75,000 is where that test will be graded.
Ethereum is at $2,358 (around £1,866), up 1.07% over 24 hours and 8.1% on the week. That weekly performance is notably stronger than Bitcoin’s 5.4%, and when ETH outperforms BTC on a sustained basis it typically signals capital beginning to broaden out from the market’s anchor asset. The daily chart has ETH above both its 20-day and 50-day averages, and funding is slightly negative, near -0.023%, which means this move is not yet driven by leveraged longs piling in. ETH dominance at 10.87% remains contained. The outperformance looks measured rather than explosive, but if it persists, the case for wider participation strengthens. If BTC dominance climbs back above 58%, that thesis weakens.
XRP is at $1.41, up 3.63% on the day and 5.5% on the week, the strongest performer in the top five over the last 24 hours. The short-term setup is positive, with the hourly and four-hour charts both bullish and price above its 20-day average. The longer view is less encouraging: XRP’s weekly structure is still bearish, sitting below key trend levels, and the move looks more like rotation into high-beta large-cap names than a standalone catalyst. The higher-timeframe damage from earlier this year has not been repaired.
Solana is at $85.30, up 2.2% on the day and 3.85% on the week. Beyond price, Solana stayed visible in the political sphere this week after a super PAC backed by the Solana Policy Institute and Multicoin Capital spent $8 million targeting Senator Sherrod Brown in an Ohio Senate race. That is not a direct price catalyst, but it illustrates how deeply crypto-aligned political spending has embedded itself into US elections. The four-hour chart is bullish and recent gains are holding, but the weekly structure remains below major trend levels. Real recovery, still unfinished.
The tension sitting underneath today’s price action is a genuine disagreement between credible data sources. CryptoQuant flagged on Wednesday that exchange inflows are rising in a pattern that historically precedes selling pressure. When holders move coins from private wallets to exchanges in larger quantities, it typically signals preparation to sell. That is a meaningful warning at a moment when Bitcoin is pressing against resistance.
K33 Research made the opposing case. The 30-day average funding rate has been negative for 46 consecutive days, matching the duration of the bear market bottom in 2022 before Bitcoin’s subsequent recovery. Prolonged negative funding exhausts sellers who pay to stay short, eventually leaving a cleaner floor. K33 argues the conditions beneath the surface are more supportive than the headline sentiment reading shows. A clean Bitcoin break above $75,000 on strong spot volume would support the K33 view. A rejection back toward $73,000 would support CryptoQuant. One of those outcomes is coming.
The most immediate test is whether Bitcoin can close a daily candle clearly above $75,000 on meaningful spot volume. That level has capped the market twice in recent sessions. A sustained break would open the path toward $78,000; another rejection back below $73,000 would restore the neutral short-term view and test the patience of recent buyers.
Watch the ETH/BTC ratio. If Ethereum continues to outperform on a weekly basis, it raises the probability that capital is spreading into the wider market. Monitor the Fear and Greed Index: a reading of 23 is unusually low for a market that has already recovered several percentage points from its lows. If the index climbs through 30 while prices hold, that confirmation carries more weight than price action alone. And watch BTC and ETH funding rates: if they flip sharply positive without a corresponding rise in spot volume, that would flag a rally built on leveraged positions rather than genuine buying, and those tend not to last.
Crypto Daily is Cristoniq’s daily guide to cryptocurrency markets, published every morning for informational purposes only. Nothing here is financial advice. Always do your own research before making any investment decisions.