Bitcoin Reclaims $75K as BNB Burn Steals Show — 20 Apr PM
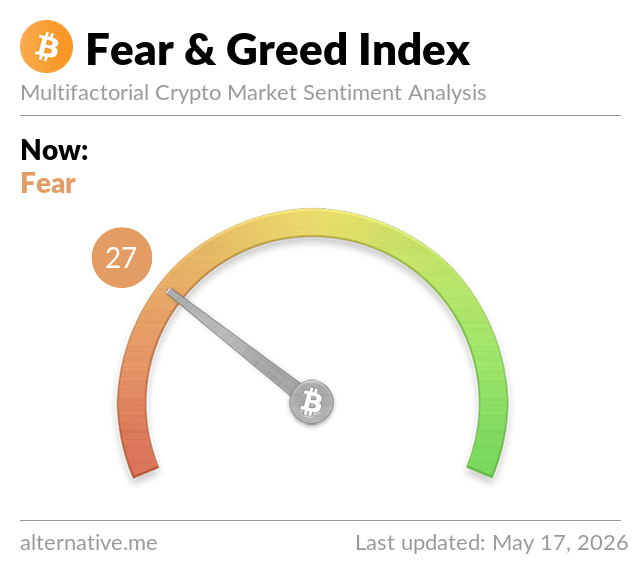
Bitcoin recovers above $75,000 after Iran talks collapse, BNB bucks the red market on $1.32B quarterly burn data. Fear & Greed: 29.
Bitcoin found its footing above $75,000 in Monday’s afternoon session, shaking off a morning low of $73,854 and a fresh wave of geopolitical anxiety after Iran’s outright rejection of US peace talks kept traders cautious across every major asset class.
Total crypto market cap stands at $2.618 trillion, with Bitcoin commanding 57.5% dominance, its highest reading in several months. Trading volume across digital assets reached $102.7 billion in the past 24 hours, healthy by recent standards but not the kind of surge that signals a new directional move. The Fear and Greed Index, a sentiment gauge running from 0 for maximum panic to 100 for peak enthusiasm, reads 29 today, firmly in Fear territory. That reading has barely shifted this week, which suggests the market has absorbed significant volatility without either collapsing or accelerating. Historically, that kind of compressed sentiment often precedes a sharp move once the stalemate breaks.
| Timeframe | Regime | What it means |
|---|---|---|
| 1 hour | Bullish | BTC recovered from the $73,854 morning low back above $75,000, short-term momentum is pointing upward |
| 4 hours | Neutral | Consolidating around the $75,000 level, neither confirming a breakout nor rolling over |
| Daily | Neutral | A modest 0.65% decline on the day with $75,000 acting as both support and resistance |
| Weekly | Bullish | Up 5.89% over seven days, the broader weekly trend remains constructive |
| Monthly | Bullish | Up 6.43% over thirty days, medium-term trend intact above key structural support |
Bitcoin is trading at $75,123 (£55,577), down 0.65% over the past 24 hours. The day’s range stretched from $73,854 to a session high of $76,165, a span of more than $2,300. The morning dip was directly caused by Iran’s rejection of a second round of US peace talks, which stripped out risk appetite during the European session and briefly dragged BTC below $74,000. New York buyers absorbed those sellers and pushed the price back above $75,000 by midday. That recovery matters more than the negative daily print. Weekly performance is up 5.89% and monthly is up 6.43%, both figures pointing to a market trending higher even as it hesitates at this specific price point. The real question is whether $75,000 functions as support or as the lower edge of a range that keeps getting retested without resolution. That answer requires a daily close above $75,500, which has not materialised yet. If it does, the next significant resistance sits near $78,000.
Ethereum is trading at $2,306 (roughly £1,705), down 1.04% on the day, with a 24-hour range of $2,257 to $2,347. The daily slip tracks the broader market, but it masks a structural advantage that ETH’s price alone does not advertise. Ethereum controls approximately 61% of the tokenised real-world assets market, which now totals over $209 billion. That institutional footprint creates persistent demand for ETH as the settlement layer for those assets, independent of daily sentiment. A weekly gain of 5.41% keeps ETH in positive territory alongside Bitcoin. The level to watch on the upside is $2,400, which marked resistance in the second week of April.
XRP is at $1.41, down 1.18% in 24 hours but up 6.72% on the week. The coin traded in a tight $1.39 to $1.44 range today, consistent with a market waiting rather than moving. Monthly performance is minus 1.76%, which distinguishes XRP from Bitcoin and Ethereum on the medium-term chart and reflects the altcoin rotation dynamic visible across this cycle. XRP’s $87.1 billion market cap keeps it firmly in the top five, but today’s price action is driven by macro correlation rather than any XRP-specific catalyst. A daily close above $1.45 would change that read and reopen territory visited earlier this month.
BNB is the single standout in today’s top five, trading at $625.64 and up 0.49% while every other major token is in the red. The catalyst is not today’s news but last week’s. On 15 April, Binance executed its 35th quarterly token burn, permanently removing 2.14 million BNB from circulation in one of the largest single deflationary events in crypto history, valued at approximately $1.32 billion at prevailing prices. The Auto-Burn mechanism, which calculates destruction amounts algorithmically based on BNB’s price and Binance Smart Chain block output with no human discretion involved, has now eliminated over 62 million BNB, passing 30% of the original 200 million supply. Post-burn price recovery has been gradual but consistent. Key resistance sits in the $645 to $651 range, with $651 representing the Bollinger Band upper boundary, the upper edge of the asset’s recent volatility envelope. A close above that level on meaningful volume would be the clearest technical signal BNB has given in this cycle.
The BNB quarterly burn deserves more examination than a headline number. Removing $1.32 billion of supply in a single algorithmic transaction, at a moment when market sentiment sits deep in Fear, is not a passive act. It is the issuer communicating that long-term supply mechanics matter more to the asset’s value than short-term price volatility, and doing so at exactly the moment when most participants are pulling back rather than committing. That framing is worth taking seriously.
The caveat is equally worth stating plainly. BNB is not a decentralised asset. Binance controls the burn mechanism, sets the parameters of the Auto-Burn formula, and determines the hard cap of 100 million tokens. Critics have a legitimate case when they describe this as centralised supply management dressed up as protocol-level economics. Burning tokens is not the same as reducing debt on a balance sheet, and the entity doing the burning is the same entity that controls most of the ecosystem giving the token its utility.
What makes the burn trajectory compelling despite those caveats is the mathematics. Binance has eliminated over 62 million BNB, and the remaining distance to the 100 million hard cap means roughly 38 million tokens left to destroy over future quarters. If the current burn cadence holds, the hard cap arrives within a predictable window and scarcity becomes less speculative and more structural. For BNB holders, the question is not whether deflation is happening. It is whether the centralised control that enables it represents a risk worth pricing in and accepting.
Three things matter most heading into the rest of this week. First, whether Bitcoin can close a daily candle above $75,500. The intraday high of $76,165 showed buyers exist at that level, but a close rather than a spike is what would signal the resistance zone has genuinely flipped to support. Second, the state of US-Iran diplomacy. Every significant headline from those negotiations has moved BTC by one to three percent within the hour over the past fortnight. Any fresh development, in either direction, will do the same. Third, watch BNB at $651. A decisive close above that level would mark the first clean breakout from BNB’s current volatility range and could attract fresh buying in the $655 to $680 zone.
Crypto Daily is Cristoniq’s daily guide to cryptocurrency markets, published every morning for informational purposes only. Nothing here is financial advice. Always do your own research before making any investment decisions.